The agricultural industry is responsible for meeting the food productions demands of an ever-growing population. Maximizing production while still protecting the environment is a grave concern in many parts of the world today. Modern food production is increasingly turning to the science of spectroscopy to monitor crop health and improve production yields.
Avantes spectrometers are trusted by researchers in the biological sciences and by agricultural equipment manufacturers to provide accurate spectral data at a fair cost. After more than two decades developing spectrology solutions for numerous applications, we have the expertise to assist with designing an optical spectroscopy system for any application.
Spectroscopy in precision agriculture eBook
In this eBook you can find out how Avantes spectrometers are on the frontlines of advances in precision agriculture and the future of feeding humanity in this collection of application papers and spectroscopic experiments.
Applications in Crop Production
Nitrogen Concentration in Rice
Monitoring plant health characteristics and improving crop conditions are instrumental in maximizing production yield. Researchers from the Institute of Digital Agriculture at the Zhejiang Academy of Agricultural Sciences in Zhejiang, Hangzhou, China developed a series of indices for the measurement of chlorophyll in the leaves of rice plants1. Chlorophyll has a very strong and well documented correlation to nitrogen content, a primary indicator of plant health.
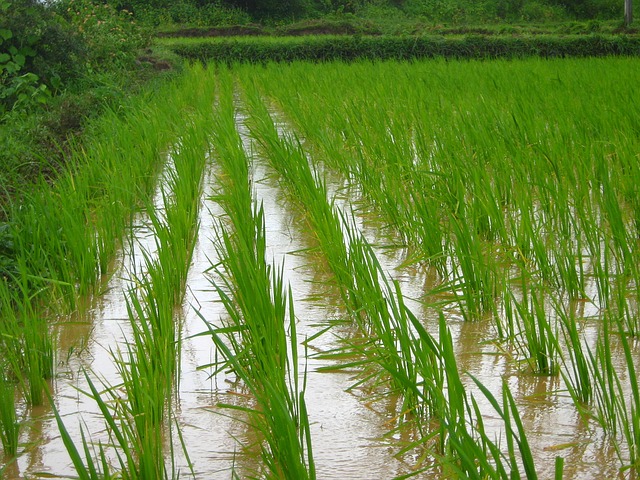
Employing an older version of the AvaSpec-ULS2048CL-EVO, these researchers explored the use of the Yellow Edge Reflectance Index (YERI) and Red Edge Reflectance Index (RERI) for calibrating nitrogen and chlorophyll values to reference spectra at each stage of plant development and varying states of plant health2. The theoretical work behind this study is applicable to other crops, once reference spectra can be correlated3,4.
Fertilizer Automation Application
The principles used by the Zhejiang researchers are employed in commercial applications in use today. Yara, the UK agricultural giant founded in 1905 and committed to technological advancement in the agricultural industry, has developed the N-sensor. This real-time, variable-rate nitrogen sensor works in concert with fertilizer spreaders to monitor plant conditions and adjust fertilizer application accordingly at the point of application. This means that the optimal amount of fertilizer is always used, both maximizing crop yield and reducing waste and environmental impact from overapplication of fertilizer.

Wheat in the Pacific Northwest
Wheat prices are set based on protein content and falling wheat prices have hurt farmers in this region in particular. The soft white winter wheat that is well suited to the climate in the PNW, has a lower protein yield than other varieties. Other varieties that are adapted for the region and have a higher protein yield also require more nitrogen fertilizer. Spectroscopy instruments were used to define a standard for measuring protein levels and the equivalent nitrogen values. This is the critical first step to developing variable-rate fertilizer technology for commercial application in the Pacific Northwest for wheat farmers5.
Food of the Future
Long-term space missions and Mars colonization projects will require humans to produce food in environments that are less than optimal for plant growth. This has important ramifications for planning to meet the dietary needs of these future colonies.

The Laboratory of Environmental Biology and Life Support Technology, in partnership with the International Joint Research Center of Aerospace Biotechnology & Medical Engineering at Beihang University, Beijing, China are studying the effects of low-intensity light on growth, photosynthesis and yield of wheat6. The researchers used an AvaSpec-ULS2048, the predecessor of the AvaSpec-ULS2048CL-EVO spectrometer to control the light intensity of different test groups at the various growth stages. They discovered that low light at early growth stages had little effect in the ultimate yield, so long as adequate light was available during the later grain filling stages.
Applications during Harvest
Maximizing harvest and monitoring produce quality on the way to market is an important piece of the puzzle in ensuring the future food supply. Spectroscopy is used at this stage of the food stream as a non-destructive method to assess produce ripeness and quality.
There are researchers around the world working in the NIR range to devise indices for standard qualitative assessment of various produce. These indices can be used in-line to automate sorting and grading at the point of harvest and after.
Among the fruits that have been studied for this type of spectroscopy measurement are Jonagold apples, sweet cherries in Hungary, peaches in Spain, and several varieties of grapes in Italy.
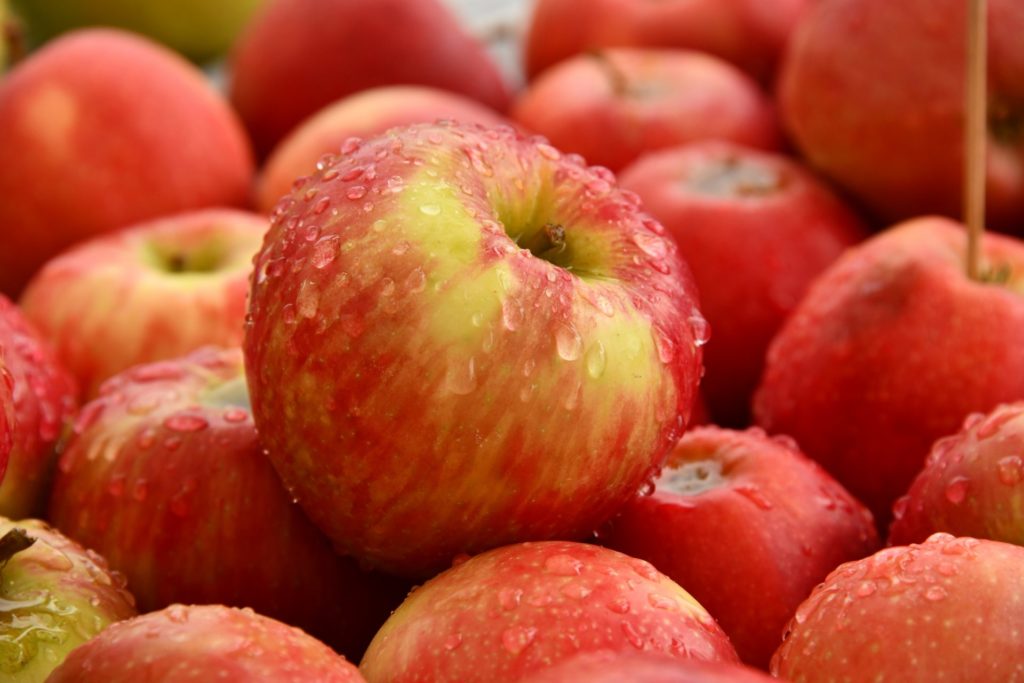
Jonagold and Fuji Apples
Avantes has previously reported on researchers working to develop standards for evaluating the ripeness and quality of Jonagold and Fuji apple varieties. Working in red, and near infrared range (600-1100nm), these studies developed several objective indices for the qualification of apple ripeness and quality based on water and soluble sugar content, as well as colour.
Sweet Cherries
Researchers in Hungary, which produces roughly 10-12 thousand tons of cherries annually, investigated the absorption characteristics of anthocyanin, a water soluble plant pigment that appears red, blue, or purple depending on minute changes in the pH of the plant. The AvaSpec-ULS2048CL-EVO proved to be an optimal instrument for working in the red spectra (570-730 nm) and in the NIR (900-970 nm), and with samples at various stages of the lifecycle and varying health status. This project ultimately developed four spectra indices to objectively qualify cherry fruit. In addition to anthocyanin, colour and water content indexes were important factors7.
Peaches
Perceived ripeness is the most important quality indicator for customers and is therefore the primary consideration after harvest.

However, how ripeness is qualified has mostly been subjective because objective tests were destructive in nature. We do know that soluble sugar content (SSC) and water content (which affects firmness) are highly correlated with fruit quality. NIR spectroscopy has been proved an effective means to measure SSC and water content due to their spectra absorption properties. Italian researchers using an early model equivalent to the AvaSpec-NIR256-1.7 worked on the development of an index standard for correlating the results of NIR spectroscopy to perceptions of ripeness allow this technology to be utilized in commercial applications to put this technology to use in the field8.
Grapes and Wine Production
Wine production is a very important industry in many parts of the world, especially in Italy. Researchers from the Department of Agricultural Engineering at the University of Milan, Italy applied Vis/NIR spectroscopy to characterization of grape composition at harvest. They sampled an astonishing 156 grape varieties throughout 2005 and 2006 while working toward a rapid in-line means of predicting ripening parameters identified to affect wine quality9.

Grape composition at harvest is the primary determinant of future wine quality. Several factors are considered in grape composition, including familiar ripeness indicators such as soluble sugar content and acidity as well as phenolic compounds anthocyanins (as in the cherries study) and polyphenols.
This study conducted with the aid of the AvaSpec-ULS2048L-EVO showed promise for the development of a portable VIS/NIR optical measurement system working in the 450-980 nm wavelength range for quick, non-destructive grape quality measurements with a 95% validation rate at the time the study was completed in 2010. Since that time, spectrometer technology has advanced to the point that these applications are a ‘ripe’ opportunity for the development of commercial systems.
Milk Production
There are several uses for spectrology in the dairy industry. Fluorescence spectroscopy is used to analyze milk content for proteins, fat, water content, carbohydrates, and minerals. The traditional chemical methods of analysis require specialized personnel and laboratory equipment and are often destructive in terms of methodology. The constituents of milk products are typically studied in the UV (185-210 nm) and NIR (800-2500 nm) wavelength ranges. Research by a team at the University of Food Technologies in Plodiv, Bulgaria is aimed, in part, at giving inspectors a tools to curb the proliferation of dairy products adulterated with the addition of vegetable fats, sugars, and foreign proteins10.
The French company Spectralys Innovation, in partnership with Actalia, the centre of expertise for the food industry, has developed the Amaltheys, a commercial fluorescence analyzer for assessing denatured whey proteins in cheese milk. This systems allows cheese producers to monitor curd coagulation and standardize cheese production yields11.

Egg and Beef Quality
Work is underway to develop methods for quality assessment of numerous other food products. Among the more interesting recent examples are the use of VIS/NIR spectroscopy to assess egg freshness and beef tenderness.
Researchers working with Beef from China Agricultural University, College of Engineering, Beijing, China are working with the AvaSpec-NIR256-2.5 spectrometer to measure characteristics of meat quality, among them: water content, fat content, colour, pH, and tenderness. In addition to studying the constituent macronutrients, this team also considered the use of NIR spectroscopy to look for common contaminants such as total volatile basic nitrogen12.
Eggs are another popular source of protein, and monitoring freshness from inside the shell was problematic; however, researchers from the Egg Quality and Incubation Research Group studied the NIR and visible light transmission spectra obtained from eggs. Using the AvaSpec-ULS2048L-EVO, the EQIRG discovered a strong connection between the transmission spectra collected and traditional measurements of egg freshness, such as pH and Haugh Units which measure protein quality based on the height of the albumin, or egg white13.
Catching Food Counterfeits
There are several food products that, due to demand or price, are frequently counterfeited. Honey and olive oil are two examples of products that are frequently adulterated or ‘counterfeit’. Honey is one of the world’s most faked foods. Adulterated alcohol has also been a topic in the news recently, with resort areas in Mexico trying to prevent the sale of these potentially deadly counterfeits. Wendy Meulebroeck and a team from the Vrije University Brussel in Belgium published a series of studies on photonics enhanced sensors in food monitoring in IEEE Instrumentation and Measurement magazine. This research employed the AvaSpec-ULS3648 spectrometer with resolution possible down to 0.1 nm, and made great strides in demonstrating the suitability of NIR spectroscopy for identification and authentication of solid and liquid food products14.
The Royal Society of Chemistry has also studied the issue of food frauds and is working on developing a point-and-shoot rapid detection method for in the field analysis of the food chain15. They evaluated the AvaSpec-NIR256-2.5-HSC for use in a system that takes rapid food analysis out of the lab and puts it on the front lines of stopping food fraud.
Avantes in Agriculture and Food
Avantes is a world leader in the development of spectroscopy solutions for real-world applications, including agricultural ones. We are trusted by researchers in working to ensure the world’s food population for the future. Find out how Avantes can support your applications, contact your sales engineer or authorized Avantes distributor today.
Related Products
Related Pages
Resources
- Hu, Hao. ‘Nitrogen Status Determination of Rice by Leaf Chlorophyll Fluorescence and Reflectance Properties’, Sensor Letters, Volume 9, Number 3, June 2011, pp. 1207-1211
- Zhang, Jinheng et al. ‘New Reflectance Spectral Vegetation Indices for Estimating Rice Nitrogen Nutrition I: Selection of Optimum Vegetation Indices Using Leaf Spectral Reflectance and SPAD Values.’ Sensor Letters, Sensor Letters, Volume 9, Number 3, June 2011, pp. 1190-1195(6)
- Zhang, Jinheng et al. ‘New Reflectance Spectral Vegetation Indices for Estimating Rice Nitrogen Nutrition II: Optimum Reflectance Spectral Vegetation Indices for Estimating Rice Leaf Nitrogen Concentration.’ Sensor Letters, Sensor Letters, Volume 9, Number 3, June 2011, pp. 1196-1200(5).
- Zhang, Jinheng et al. ‘New Reflectance Spectral Vegetation Indices for Estimating Rice Nitrogen Nutrition III: Development of a New Vegetation Index Based on Canopy Red-Edge Reflectance Spectra to Monitor Rice Canopy Leaf Nitrogen Concentration.’ Sensor Letters, Sensor Letters, Volume 9, Number 3, June 2011, pp. 1201-1206(6).
- Zhou, Yi et al. ‘Strategic Nitrogen Supply Alters Canopy Development and Improves Nitrogen Use Efficiency in Dryland Wheat.’ Agronomy Journal 109(3) January 2017.
- Dong, Chen et al. ‘Low light intensity effects on the growth, photosynthetic characteristics, antioxidant capacity, yield and quality of wheat (Triticum aestivum L.) at different growth stages in BLSS’. Advances in Space Research Volume 53, Issue 11, 1 June 2014, Pages 1557-1566
- Attila, Nagy, and Tomas Janos. ‘Sweet Cherry Fruit Analysis with Reflectance Measurements.’ University of Oradea, Department of Environmental Protection Vol. 17, 2011.
- S. Capone, et al. ‘Analysis of Peaches Ripeness by an Electronic Nose and Near-Infrared Spectroscopy’ Sensors and Microsystems: Proceedings of the 7th Italian Conference. Bologna, Italy. 2002
- Guidetti, R. et al. ‘Evaluation of grape quality parameters by a simple Vis/NIR system‘. Transactions of the ASABE 2010 Vol.53 No.2 pp.477-484 ref.28
- Dimitrova, T.L. et al. ‘Scattering and Fluorescence Spectra of Cow Milk.’ Bulgarian Chemical Communications, Vol.46 iss. B (pp. 39-43). December 10, 2014.
- P. Lacotte et al. ‘Amaltheys: A fluorescence-based analyzer to assess cheese milk denatured whey proteins.’ Journal of Dairy Science. 2015 Oct; 98(10):6668-77.
- Peng, Yankun, and Wenxiu Wang. ‘Application of Near-infrared Spectroscopy for Assessing Meat Quality and Safety.’ 1 Jan. 2015.
- Kemps, Bart et al. ‘Visible transmission spectroscopy for the assessment of egg freshness.’ Journal of the Science of Food and Agriculture, 2006.
- Meulebroeck, Thienpont, and Ottevaere. ‘Photonics enhanced sensors for food monitoring: part 1.’ IEEE Instrumentation Measurement Magazine. Volume: 19, Issue: 6, December 2016.
- Royston Goodacre et al. ‘Point-and-shoot: rapid quantitative detection methods for on-site food fraud analysis – moving out of the laboratory and into the food supply chain.’ Analytical Methods, 1 Jan. 2015.